

Measuring customer experience in an accurate, meaningful way helps to better understand our customer’s needs and create measurable internal goals. When our goals are clear, they are easier to represent and check for positive progress. Demonstrating our long-term progress shows our commitment to providing the best customer experience.
As we look ahead, why do we measure customer experience? We need to know where we are now so that we can set goals to improve in the future. Over time, we want to see positive change to ensure that we are providing the highest level of customer experience as we possibly can. We can demonstrate measurable success from before and after having customer experience baked into every aspect of our work as a department; procurement, decision-making, budgeting, and beyond.
- Creating a Shared Customer Experience Vocabulary
-
- Customer Experience (CX) Metrics: the standards by which customer experience is measured.
- At USDA, we believe that measuring our CX progress is the only way to ensure that we are making positive progress towards our goals as a department.
- Key Performance Indicator (KPI): a measurable target indicating how individuals or businesses are performing in meeting their goals.
- At USDA, we use KPIs to identify CX metrics and goals so that we can track our progress towards a better Department-wide customer experience.
- Human-Centered Design (HCD): An interdisciplinary methodology of putting people, including those who will use or be impacted by what one creates, at the center of any process to solve challenging problems.
- At USDA, human-centered design is at the core of the frameworks we develop to approach customer experiences. We aim to work with customers, utilizing methods including co-design and an iterative approach to find the best solutions to the challenges we face in our day-to-day work.
- Customer Experience (CX) Metrics: the standards by which customer experience is measured.
Setting Stakeholder Expectations
Maximizing buy-in ensures the metrics collected are appropriately acted upon within a timely fashion. To set yourself up for success, follow these guidelines for effectively communicating your process to leadership and stakeholders. For further guidance, use the linked resource for each step of the process.
- Define the Goal (PDF, 196 KB)
- Discuss the Data (PDF, 195 KB)
- Discuss the Value (PDF, 196 KB)
Key Performance Indicators
Measuring customer experience is an important first step to placing customer experience at the center of decision-making to encourage positive customer experiences and improvements in customer experience.
- Trust: Captures customer confidence. Overall Trust can be measured on three levels based on length of time: (1) transaction; a single interaction, (2) journey; several interactions, and (3) relationship; the entire relationship between USDA and a customer. Trust should be measured with a “thumbs up/down” binary measurement.

- Net Promoter Score (NPS): Rates the likelihood a customer would recommend a company, product, or a service to a friend or colleague.
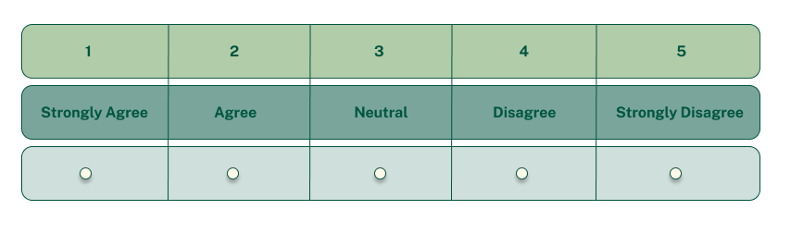
- Overall Satisfaction: Captures the overall satisfaction that a customer experiences within a transaction or with a product.
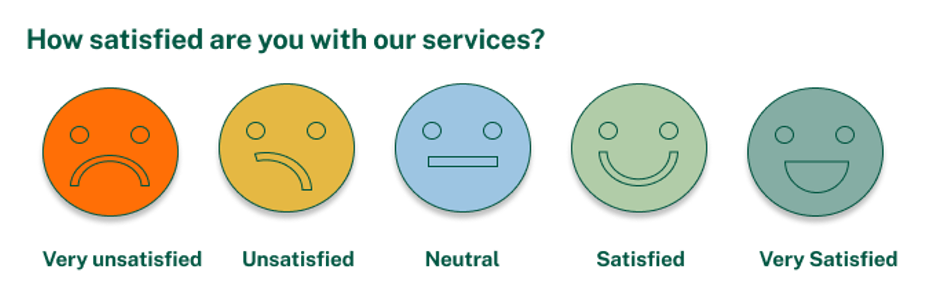
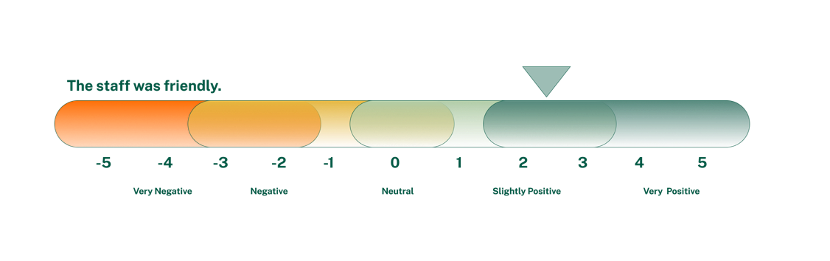
- Sentiment: The positive or negative feeling a customer has following an interaction based on an analysis of open-text feedback.
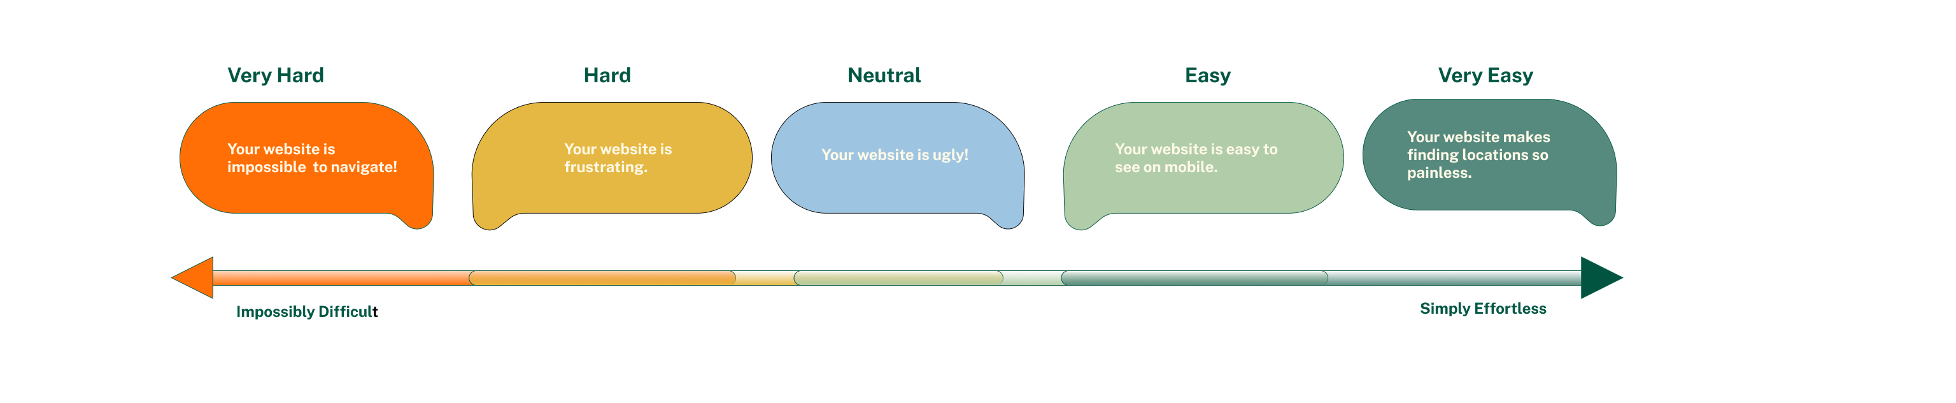
- Effort: Evaluates how hard or easy customers perceive their interaction with a product or service.
What metrics gathering method is right for me?
The most common and methods for gathering metrics are:
- Surveys
- Interviews
- Focus Groups
Your audience and what part of customer experience you are looking to understand will determine what metric collection method is best for you. Use the flowchart below to help find a suggested method:
Selecting a Tool for Collecting Metrics
The USDA Office of Customer Experience (OCX) recognizes that every office and Mission Area has different needs, resources, and availability and may require different solutions for effectively gathering metrics. We encourage you to explore all the options that are available to you for collecting metrics that work best for your office. Some solutions may include:
- Touchpoints, a free, entry-level web application as a customer listening tool that can effectively measure feedback through the creation and distribution of surveys created by the General Services Administration (GSA) that is Paperwork Reduction Act (PRA)-approved.
- Using a paid subscription tool; communicate with the Office of Customer Experience (OCX) and Office of the Chief Information Officer (OCIO) to see what tools are currently available for use
- Partnering with other government offices
- Hiring new staff or utilizing contractors
Compliance and Approval for External Customer Research
Are you collecting data using standardized questions with 10 or more respondents within a 12-month period? You will likely need Office of Management and Budget (OMB) approval to stay in accordance with the Paperwork Reduction Act (PRA) of 1995.
- Getting OMB Approval
- The process for obtaining PRA Clearance varies depending on the subject matter data is being collected on. The processes can differ from agency to agency, both on the level of detail required and platform for submission. There are two avenues for obtaining PRA Clearance:
- Traditional Clearance (requires a 60-day Federal Register Notice)
- Fast-Track Clearance (does not require a 60-day Federal Register Notice and includes customer experience activities such as comment cards, focus groups, usability studies, and some surveys but findings cannot be published or publicly reported)
- The 3410-001 Departmental Regulation (DR), “Information Collection Request Activities: Collection of Information from the Public” outlines the approval process when the Mission Area completes any survey activity.
- The process for obtaining PRA Clearance varies depending on the subject matter data is being collected on. The processes can differ from agency to agency, both on the level of detail required and platform for submission. There are two avenues for obtaining PRA Clearance:
- Questions? Contact the PRA coordinator for your agency.
- Don’t know or don’t have an agency PRA coordinator for public-facing surveys and other data gathering/information collection (IC) activities? Contact Ruth Brown, Departmental Information Clearance Officer (ruth.brown@usda.gov)
Surveys
Surveys can be most useful when your audience is very broad, you plan to use standardized questions, and you are trying to collect mostly quantitative data.
For further guidance, use the linked resource for each step.
- Finding a Target Audience (PDF, 110 KB)
- Writing Questions (PDF, 77.4 KB)
- Standardized Survey Questions (PDF, 225 KB)
- Standardized Customer Service Center Questions (PDF, 229 KB)
- Standardized Optional Questions (PDF, 217 KB)
- Distribution (PDF, 173 KB)
- Reflecting and Reacting (PDF, 96.8 KB)
Interviews
One-on-one interviews can be helpful for gaining insights and perspectives from an individual point of view. This tool can be most helpful when you have a specific audience you are trying to better understand. If you can interview people from a specific audience, you can pinpoint the barriers, pain points, challenges, and opportunities for improvement with greater precision and context.
For further guidance, use the linked resource for each step.
- Recruiting Participants (PDF, 45.1 KB)
- Writing Interview Questions (PDF, 174 KB)
- Facilitator Guide (PDF, 249 KB)
- Understanding Data (PDF, 208 KB)
- Reflecting and Reacting (PDF, 96.4 KB)
Focus Groups
Focus groups provide an opportunity to observe and learn from organic conversations that occur among small groups of peers. Ensuring your focus groups are made up of peers and not staff with their supervisors is vital to get good data to guide your decision-making.
For further guidance, use the linked resource for each step.
- Recruiting Participants (PDF, 45.1 KB)
- Writing Focus Group Questions (PDF, 174 KB)
- Facilitator Guide (PDF, 249 KB)
- Understanding Data (PDF, 209 KB)
- Reflecting and Reacting (PDF, 95.3 KB)
Understanding Customers through Journey Mapping
Customer journey maps provide an end-to-end view of a customer's total experience. It outlines pain points and highlights areas of success to better align goals, desired outcomes, and strategic priorities. Creating a customer journey map allows us to identify different personas and better understand their interactions with our products and services.
The most common measurable themes to identify in a journey map are:
- Emotion: How do customers feel about this product/service? (Measured with overall satisfaction questions.)
- Effectiveness: Do customers achieve their goals by using this product/service? (Measured with effort questions.)
- Ease of Use: How easy is this product/service to use? (Measured with effort questions.)
- Efficiency: Are we providing the best service with the least amount of customer burden? (Measured with effort questions.)
Examples of USDA Journey Maps and Personas
Below are examples of journey maps and persona building that has been done for past USDA projects. While these are larger in scale, even a more abbreviated version of a persona and/or journey map can be helpful when gathering and understanding customer experience metrics for your own project or program.