This post is part of the Science Tuesday feature series on the USDA blog. Check back each week as we showcase stories and news from USDA’s rich science and research portfolio.
As economists, we recognize that people respond to incentives, and prices are among the strongest incentives. So as the price of something falls, people will generally purchase more of it. It’s a principle that policymakers and health advocates sometimes apply to encourage healthy dietary choices—such as eating more fruits and vegetables. The Agricultural Act of 2014 sets up a new grant program to support projects that encourage participants in USDA’s Supplemental Nutrition Assistance Program, or SNAP, to buy more fruits and vegetables. The grants will provide Federal matching funds to nonprofit and governmental organizations for projects that reduce the cost of fruits and vegetables to SNAP recipients. Many of these efforts currently focus on increasing SNAP recipients’ buying power at farmers’ markets.
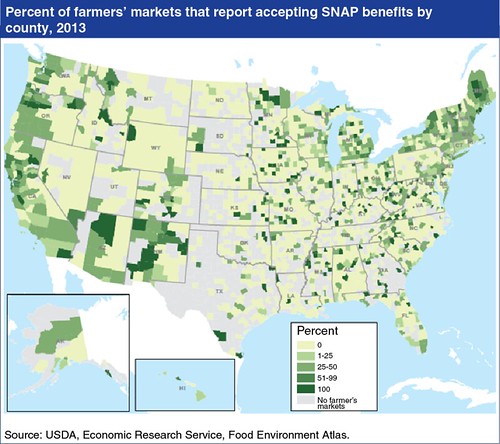
Researchers at my agency, USDA’s Economic Research Service (ERS), have harnessed the power of Geographic Information Systems to visually display where U.S. farmers’ markets are located and what portion of those markets reported accepting SNAP benefits as payment. The farmers’ market data on SNAP benefit acceptance, based on reporting by the farmers’ markets, are among 22 new statistics recently added to ERS’s popular Food Environment Atlas. The Atlas is an interactive tool for mapping a wide range of county-level indicators of the food environment, food assistance, and affordability—indicators such as distance to full-service grocery stores, incomes and poverty rates, health outcomes, and State-level participation rates for food assistance programs.
In 2013, about one in every four farmers’ markets reported accepting SNAP benefits. But, the proportion of SNAP-accepting farmers’ markets isn’t uniform across the country. In 156 counties, all farmers’ markets reported accepting SNAP benefits, and in 242 counties, over half of farmers’ markets reported accepting SNAP. However, in about two-thirds of the counties with at least one farmers’ market, no markets reported accepting SNAP. Areas in the Northeast, Southwest, and along the West Coast have a relatively high percentage of farmers’ markets that report accepting SNAP.
The other new statistics in the Atlas include:
- Farmers’ markets that accept WIC vouchers and Senior Farmers’ Market Nutrition Program benefits
- State-level policies related to SNAP eligibility and reporting requirements (for example, allowing online application or simplified reporting for households with earnings)
- Food distribution sites operating on Indian reservations
- State-level rates of very low food security
By observing patterns of these and other food environment indicators and of health outcomes, such as diabetes and obesity rates, we can identify disparities, associations, and maybe, eventually, causes and solutions.
We encourage you to visit the U.S. Food Environment Atlas on the ERS website.