
nass

U.S. Sweet Potato Production Swells

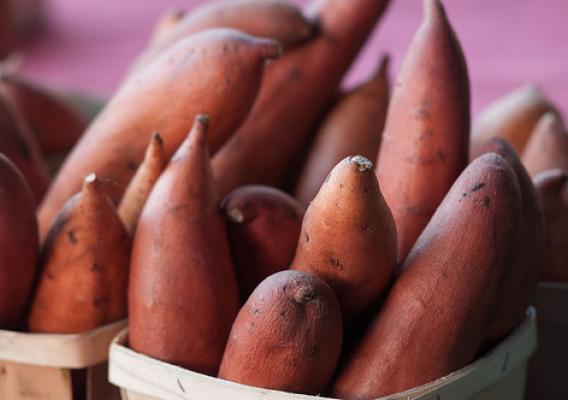
Chances are that if you order a side of fries at a restaurant, you need to specify whether you’re asking for white potatoes or sweet potatoes. Food trends that support the consumption of more healthful, colorful and unique foods have helped to encourage sales of sweet potatoes in the form of fries, chips, ready-to-cook and heat-and-eat preparations, expanding consumption of the orange tuber well beyond the holiday table.

Domestic consumption of sweet potatoes has grown considerably since 2000 with annual per capita availability (a proxy for consumption) rising from 4.2 pounds to reach a record-high 7.5 pounds in 2015. The marked rise in domestic demand has been encouraged by promotion of the health benefits of sweet potatoes – rich in vitamins A and C, high in fiber. Expanded demand has also been supported by the increasing variety of sweet potato products available in restaurants and for home preparation.

Two NASS Surveys Critical for USDA Crop Programs for Farmers

When drought and flooding impact crop production, or even in a year with good yields, good data is crucial to the agriculture industry.

USDA’s National Agricultural Statistics Service (NASS) conducts more than 400 surveys each year.  Two of our larger and more impactful surveys are the annual Row Crops County Agricultural Production Survey (CAPS) and December Agricultural Survey, the results of which are combined to set our county average yields.

Growth and Opportunity in the Organic Sector

Since USDA’s Agricultural Marketing Service (AMS) implemented the organic regulations in 2002, the U.S. organic sector has tripled in size to over 22,000 certified organic operations with over $43 billion in U.S. retail sales.  Demand for organic products is expected to continue growing.  This strong consumer demand outruns supply, providing market opportunities within the organic sector.

USDA offers many resources for organic producers and businesses – including organic certification cost share assistance, organic price reporting, conservation programs, and so much more – to facilitate growth within the organic sector. We also provide assistance to producers transitioning to organic production, and work to facilitate international trade.

Agricultural Data Users Weigh-in on USDA Statistical Programs

As I’ve learned over my years with the National Agricultural Statistics Service (NASS), in order to make an impact, our information needs to meet the needs of the people who use the data we produce. And while we constantly try to gauge and meet their needs, it is imperative to speak to our data users directly to get their input. We are open to feedback all the time and we hold annual special Data Users’ Meeting in Chicago every October.

Of course face-to-face interaction has its limitations since not everyone can travel to Chicago to meet with us. To address this concern, for the first time this year, we are also adding a social media component to our Data Users’ Meeting. Immediately following the panel session at the meeting, from 5 p.m. to 5:30 p.m. Central Time, I will be answering questions via Twitter during our monthly #StatChat.

USDA Market News - As Diverse as the Agricultural Landscape

As the agricultural landscape evolves to meet consumer demand, USDA Market News works to ensure that emerging sectors have the unbiased, reliable data they need to succeed in the marketplace.

USDA Market News – administered by USDA’s Agricultural Marketing Service (AMS) – provides data that serves as the information lifeline for America’s agricultural economy.  Everyone in the ag supply chain is accustomed to visiting Market News for items like current wholesale and retail prices for beef cuts, but here at AMS we offer so much more.

Working with Livestock Industry to Provide Critical Market Intelligence

The Livestock Mandatory Price Reporting (LMR) Program was created to expand pricing information available to the livestock industry.  The data is collected and distributed by USDA’s Agricultural Marketing Service (AMS) through its USDA Market News division to provide market information for cattle, swine, lamb, and livestock products.

LMR encourages competition in the marketplace by vastly improving price and supply data, bringing transparency, breadth and depth to market reporting.  Through LMR, livestock producers and processors, retail food outlets, restaurants, exporters, and many other stakeholders receive critical market intelligence on a daily basis.  Literally thousands of business transactions every day rest on the outcome of LMR data.

Measuring Hazelnuts in Oregon

Few realize that Oregon produces 99 percent of the hazelnuts in the United States. That means that an accurate forecast of hazelnut production in the Beaver state assists the industry in determining marketing plans and price. To do that, USDA’s National Agricultural Statistics Service runs a joint project with the Hazelnut Marketing Board of Oregon, which allows us to measure the most accurate production yields and forecasts for hazelnut production possible. This project is called the Oregon Hazelnut Objective Yield Survey.

When it comes to forecasting production of a particular commodity, there are various methods we can use. Predominantly we survey growers to get their estimate of their own farm production. We combine the farmers’ responses with objective yield measurements. In brief, we use the objective yield survey to count and measure the crop prior to harvest so that we can see what kind of crop we can truly expect by the end of the growing season.

When it Comes to Cotton, Texas Rules

Lone Star state growers are responsible for 56 percent of the U.S. acres planted to cotton and about 45 percent of the total cotton production. But how do we measure this crop accurately enough to make dependable forecasts for cotton yield and production? That’s where our measurement process, known as the objective yield kicks in.

All of the objective yield measurements are done by a well-prepared team of National Agricultural Statistics Service (NASS) enumerators. For this growing season, we spent the week of July 12-14 training 43 enumerators with a combination of classroom and hands-on field practice. Since approximately 63 percent of the Texas crop, which represents 30 percent of the U.S. total cotton crop, comes from the High Plains of Texas, this group has the bulk of the samples in Texas.

Relationships and Technology Are the Keys to Better Data for Farmers and Ranchers

Like nearly all organizations that use surveys to collect information, we have seen declining response rates in recent years. The value of accurate data is now more important than ever for decision-making on the farm, and by USDA farm program administrators, policy makers, researchers, market participants and, really, every aspect of agriculture. It is critical that we work closely with potential respondents and their industry representatives.

End-of-year crop production and stocks surveys, including the county agricultural production survey, which are critical for the Farm Service Agency and the Risk Management Agency to administer programs that benefit farmers and ranchers are upon us.  These agencies need accurate data to serve producers with beneficial programs such as the Price Loss Coverage (PLC), Agriculture Risk Coverage (PLC), Conservation Reserve Program (CRP) and many crop insurance programs.

NASS Data Fuel USDA Programs to Help Agriculture in America

Farmers are unique in that they touch every single American every single day, because we all eat. Ensuring a continuity of agriculture is important to all of us. To take the pulse of U.S. agriculture, we conduct a Census of Agriculture every five years which gives us a comprehensive analysis of agriculture in America and supplements information from more than 400 other surveys we conduct each year.

Our last census was in 2012, and the resulting data showed a decline in the number of new and beginning farmers compared to the previous census in 2007. On top of that decline, we saw the average age of American farmers trending upward to 58 years old. The USDA took these two pieces of information and recognized the need to encourage new and beginning farmers.