
nass

That’s a Wrap: New Certified Organic Data Released during National Organic Harvest Month

USDA’s National Organic Program defines organic production as a system that is managed to respond to site specific conditions by integrating cultural, biological, and mechanical practices that foster the cycling of resources, promote ecological balance, and conserve biodiversity.

National Chicken Month – NASS Counts Chickens Before – and After – They Hatch

Did you know that Georgia poultry farmers produced the greatest number of chickens for meat (broilers) with 1.4 billion in 2016 followed by Alabama and Arkansas with just over 1 billion each? In all, the total value of U.S. broiler chicken production was $25.9 billion in 2016.

Being Serious about Saving Bees

Pollinators are a vital part of agricultural production. In the United States, more than one-third of all crop production – 90 crops ranging from nuts to berries to flowering vegetables - requires insect pollination. Managed honey bee colonies are our primary pollinators, adding at least $15 billion a year by increasing yields and helping to ensure superior-quality harvests.

Serving Twice: Military Veteran Farmers Get a New Question in the Census of Agriculture

I am a rancher and a military veteran, in addition to being a data collection coordinator for USDA’s National Agricultural Statistics Service (NASS). That makes me particularly passionate about one of the additions to this year’s Census of Agriculture: a question about military veteran status. All of us will have the opportunity to document on the census whether we have served or are currently serving on active duty in the U.S. Armed Forces, Reserves, or National Guard.

Celebrate National Ag Day: Make Sure You're Counted in the 2017 Census of Agriculture

In just a few months, America’s farmers and ranchers will have the opportunity to strongly represent agriculture in their communities and industry by taking part in the 2017 Census of Ag. This National Ag Day, we are sharing the three things you can do now to help us in this tremendous endeavor.

U.S. Agricultural Production Systems of the Future: What Research is Needed Now?

Depending on where you live in the United States, the first thing that likely comes to mind for agriculture production systems are the large fields of corn, soybeans, wheat or cotton seen growing each summer. But spend a few minutes looking at CropScape, a color-coded map that charts where almost a hundred different types of U.S. crops are grown currently, and you begin to appreciate the diversity and regionality of production systems. This map shows that although there are U.S. regions where crop production is dominated by a few commodity crops, there are others where U.S. farmers are growing a wide array of fruit, vegetables, and other “specialty” crops. Agricultural Atlas maps produced by USDA’s National Agricultural Statistics Service show similar diversity in livestock production, including land in pasture and range production.

Honey: A Sweet Topic with New Data this Spring

This post is part of the Science Tuesday feature series on the USDA blog. Check back each week as we showcase stories and news from USDA’s rich science and research portfolio.

Every day, National Agricultural Statistics Service (NASS) statisticians work hard to produce timely, accurate and useful statistics to U.S agriculture. In addition to producing hundreds of reports each year on crops, livestock and economic indicators for the agriculture industry, NASS collects and reports annual data for honey bee colonies. Historically, we’ve only surveyed operations or farms with five or more colonies, but in 2015 we expanded the survey to cover operations of all sizes. As a statistician who is also a beekeeper, I am pleased to provide valuable information about honey as a public service and decision-making tool.

Innovation is Driving Down Greenhouse Gas Emissions from Corn-based Ethanol

Ethanol, primarily derived from corn, supplies about 10 percent of US motor fuel needs.  A new study from ICF which was released today, titled “A Life-Cycle Analysis of the Greenhouse Gas Emissions of Corn-Based Ethanol,” finds that greenhouse gas (GHG) emissions associated with corn-based ethanol in the United States are about 43 percent lower than gasoline when measured on an energy equivalent basis.  This is comparable to reducing GHG emissions in the U.S.

Bringing it Home at the End of the Year

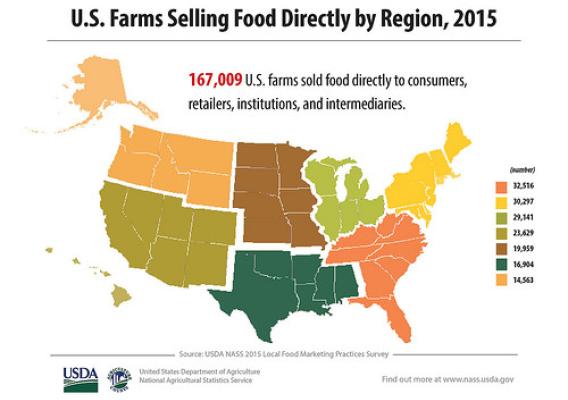
According to recent data on local food marketing practices, 167,000 U.S. farms locally produced and sold food through direct marketing practices, resulting in $8.7 billion in revenue. Pennsylvania led the U.S. in the number of farms selling directly to consumers, with more than 6,000 operations. California led in sales, earning $467 million. The survey also concluded that more than 80 percent of all direct market food sales occurred within 100 miles of the farm.

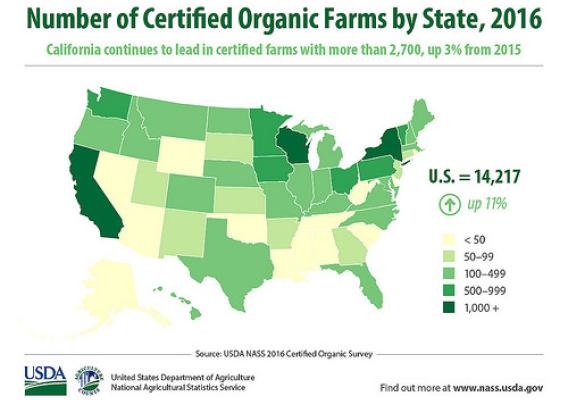
Local foods, pollination, organic products, fats and oils—these are just a few of the topics on which NASS recently began collecting and reporting data to meet data interests and requests, adding to our long-standing information on major commodities. We are innovating and building on more than 150 years of service to rural America with agriculture statistics. The value of accurate data is now more important than ever for decision-making on the farm, and by USDA farm program administrators, policy makers, researchers, market participants and, really, every aspect of agriculture.