nass

Livestock Mandatory Reporting - Bringing Transparency to the Marketplace

The Livestock Mandatory Price Reporting (LMR) Program was established to expand pricing information available in the livestock industry. Part of USDA Market News data, the information is distributed by the Agricultural Marketing Service (AMS) and allows analysts to dive in head first and fulfill all of their number crunching ambitions.

The purpose of the program is to provide marketing information for cattle, swine, lamb, and livestock products that can be readily understood and utilized by producers. Livestock Mandatory Reporting encourages competition in the marketplace by vastly improving price and supply data, bringing transparency, breadth and depth to market reporting. The program gets its authority through the Livestock Mandatory Reporting Act of 1999, which must be reauthorized by Congress every five years. The program is up for reauthorization in September 2015.

Land of 10 Thousand Lakes and 20 Million Turkeys

The Census of Agriculture is the most complete account of U.S. farms and ranches and the people who operate them. Every Thursday USDA’s National Agricultural Statistics Service will highlight new Census data and the power of the information to shape the future of American agriculture.

As we’re bracing for another arctic winter blast here in Minnesota, it is the perfect time for me to get indoors and introduce you to our state’s agriculture with the help of the results from the most recent Census of Agriculture.

While, according to the Census Bureau, less than 1 percent of our state’s population are involved in agriculture, our state ranks fifth in the United States for the value of agricultural products sold. In 2012, Minnesota farmers sold nearly $21.3 billion worth of products.

U.S. Farms, Large and Small

This post is part of the Science Tuesday feature series on the USDA blog. Check back each week as we showcase stories and news from USDA’s rich science and research portfolio.

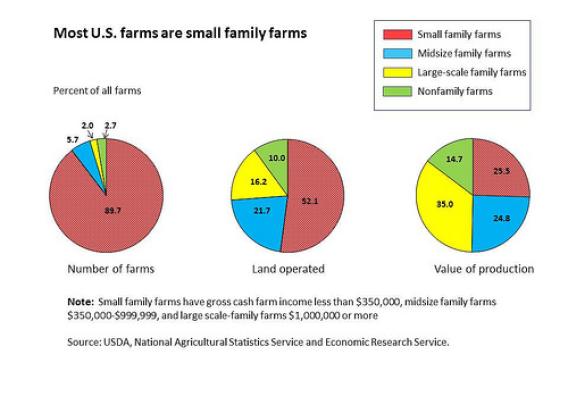
Describing the structure of the U.S. farm sector is challenging, because farms vary widely in size and other characteristics.  Are they largely family businesses, or corporate operations?  U.S. farms range from very small retirement and residential holdings to businesses with sales in the millions of dollars. And descriptions based on U.S. averages hide much of the variation.

The Economic Research Service prepares periodic reports on family farms that provide detailed information for policy makers and others interested in farm policy and the farm sector.  The reports draw on data from a scientifically designed USDA survey, the Agricultural Resource Management Survey, or ARMS.  The survey, conducted annually, covers all types of farms, and is designed to accurately represent farms and farm households, including financial conditions and production practices.

Broiler Industry Stretches Its Economic Wings in Delaware

The Census of Agriculture is the most complete account of U.S. farms and ranches and the people who operate them. Every Thursday USDA’s National Agricultural Statistics Service will highlight new Census data and the power of the information to shape the future of American agriculture.

The New Year is upon us and we are resuming our Census of Agriculture profile blog series. It’s fitting that Delaware is profiled first in 2015, because Delaware’s nickname is “The First State” because it was the first of the 13 original states to ratify the United States Constitution on December 7, 1787.

Although Delaware is the 2nd smallest state in the nation, its value of agricultural production exceeds that of 10 larger states. According to the 2012 Census of Agriculture, Delaware had 2,451 farms which produced $1.3 billion in agricultural sales. That works out to an average of $520,000 per farm and ranks Delaware #2 in the nation behind California in per farm sales! Delaware ranks #1 nationally in the value of agricultural sales per farmland acre at $2,505 and also for lima bean production.

Looking Under the Hood of Michigan's Agriculture

The Census of Agriculture is the most complete account of U.S. farms and ranches and the people who operate them. Every Thursday USDA’s National Agricultural Statistics Service will highlight new Census data and the power of the information to shape the future of American agriculture.

When you think of Michigan, you may think of Detroit and the car industry, however our agriculture industry is also critical to our state’s economy. Agriculture’s economic impact on the Michigan economy recently surpassed the $100 billion mark. Traveling through Michigan, you can easily see just how diverse agriculture in our state truly is. In the latest Census of Agriculture, Michigan farmers reported growing many various types of fruits, vegetable and livestock commodities. In fact Michigan produces more than 300 different commodities.

While the Great Lakes provide our crop growers with an abundance of fertile lands and water, it is our dairy farmers that produce our most valuable commodity. According to the Census, in 2012, Michigan dairy farmers sold more than $1.5 billion worth of milk from their cows. And despite the decrease in the number of such farms, the number of dairy cows in Michigan keeps growing. As of 2012, there were more than 376,000 milk cows on 2,409 of our dairy farms.

O Christmas Tree, O Christmas Tree, How Do We Count Thee?

Just as millions of Americans venture out this time of year to purchase a fresh cut Christmas tree, I too am busy visiting and talking with Christmas tree growers. However for me, the visits are important outreach opportunities with producers to prepare for the 2014 Census of Horticulture, which we at USDA’s National Agricultural Statistics Service (NASS) just mailed this week.

This special study will help us do more than just count Christmas trees. It will look at the entire horticulture sector in the United States and gather a full count of this $14.5 billion industry. The Census of Horticulture will paint a detailed picture of U.S. producers nationwide – those who grow all those cherished holiday trimmings, from fresh cut Christmas trees, to poinsettias, holly and more.

Hearing First-Hand How Diversity Matters

The men and women who own and operate our country’s farms and ranches are increasingly diverse. In fact, according to USDA’s 2012 Census of Agriculture, all categories of minority-operated farms increased between 2007 and 2012.  The number of farms operated by Hispanics has increased by 21 percent in just five years.

My agency, USDA’s Agricultural Marketing Service (AMS), oversees all 22 industry-funded commodity research and promotion (R&P) programs.  Led by industry board members appointed by the Secretary of Agriculture, these programs provide a framework for farmers and businesses to pool resources, set common goals and make collective decisions about how to best develop new markets, strengthen current markets and conduct important research and promotion activities.

A Potato's Eye on Idaho Agriculture

The Census of Agriculture is the most complete account of U.S. farms and ranches and the people who operate them. Every Thursday USDA’s National Agricultural Statistics Service will highlight new Census data and the power of the information to shape the future of American agriculture.

When it comes to potatoes, Idaho is #1. Results of the 2012 Census of Agriculture confirmed it. According to the census, Idaho farmers led the United States in acres of potatoes harvested, at 345,217 acres. And believe it or not, this was done by only 794 farms. On these farms, 58 percent of the potato harvested acres were for the fresh market and 42 percent were for processing.

Of course, the other parts of our agriculture are no small potatoes either. Overall, in 2012 we had 24,816 farms in our state, and our farmers sold more than $7.8 billion worth of agricultural products. Nearly a third of that amount – $2.3 billion – came from milk sales. Only three states, California, Wisconsin, and New York, had more milk sales than Idaho. Idaho’s Gooding County ranked fourth in the nation for milk cow inventory. The 2012 census counted nearly 179,000 head of milk cows there.

Surveys Help with Land Rental Negotiation

This post is part of the Science Tuesday feature series on the USDA blog. Check back each week as we showcase stories and news from USDA’s rich science and research portfolio.

Farmland is one of the biggest assets in U.S. agriculture.  According to the most recent Census of Agriculture, American farmers own more than half of all U.S. farmland—however, more than 350 million acres are rented or leased.  This means that hundreds of thousands of farmers are affected by rising farmland values and have to negotiate their land rental agreements regularly.

That’s where data comes in. Every year, we reach out to thousands of farmers across the nation to determine accurate estimates for farmland values. After all, to negotiate a fair deal, it helps to know the actual value of the land you already rent or hope to rent in the future. That’s also how we at USDA and other key policymakers know that U.S. farmland values have been increasing pretty steadily over the past decade.

Five Cs of Arizona

The Census of Agriculture is the most complete account of U.S. farms and ranches and the people who operate them. Every Thursday USDA’s National Agricultural Statistics Service will highlight new Census data and the power of the information to shape the future of American agriculture.

For decades, school children in Arizona have been taught the five Cs: Copper, Cattle, Cotton, Citrus, and Climate. These five C’s have been the driving force behind Arizona’s economy, and gave economic security to past generations and hope to many generations. However, all that is changing. Arizona, like the rest of the country, is undergoing an economic transformation. Arizona is moving from a mining and agriculturally oriented economy, to a high-technology and service-based economy. This is changing the patterns of where Arizonans live and work.

Three of Arizona’s Cs – cattle, cotton, and citrus – were counted in the most recent Census of Agriculture and the results showed that they are still economically significant. The value of cattle, cotton and citrus production that was sold in 2012 totaled nearly $940 million, excluding the more than $760 million in milk sales. Total market value of all agricultural products sold topped $3.7 billion.