nass

In Vermont the Hills are Alive and the Maple's Flowing

The Census of Agriculture is the most complete account of U.S. farms and ranches and the people who operate them. Every Thursday USDA’s National Agricultural Statistics Service will highlight new Census data and the power of the information to shape the future of American agriculture.

Farming is pretty sweet in Vermont. After all, our producers rule U.S. maple syrup production. According to the 2012 Census of Agriculture, Vermont’s 1,523 “sugar makers” produced just under a million gallons of this sweet syrup. That’s more than 44 percent of all the maple syrup produced in the United States. The 2015 maple season will be starting soon. Daytime temperatures in the 30s and 40s with nighttime temperatures below freezing are needed for the maple sap to start flowing.

While Vermont’s terrain is excellent for maple trees, our hills and valleys are also pretty ideal for livestock. The dairy sector stands out in Vermont with about 900 dairy farms that generated more than 65 percent of the total value of agricultural product sales in 2012. That’s more than $504 million and makes us one of the top 20 states by value of sales of milk from cows. You have to admit that’s pretty impressive, considering that we are one of the smallest states in the union. More than 428,000 acres of our cropland are dedicated to corn and hay forage crops, largely supporting the dairy sector.

New Ag Statistics Showcase Importance of U.S. Agriculture

This post is part of the Science Tuesday feature series on the USDA blog. Check back each week as we showcase stories and news from USDA's rich science and research profile.

At the recent Agricultural Outlook Forum I had the pleasure of speaking with hundreds of people regarding a new program I’m very excited about: the Current Agricultural Industrial Reports (CAIR). Here at NASS, we publish hundreds of reports every year on inventory, production, and values of U.S. agriculture products. The CAIR program takes us a step beyond. CAIR provides a glimpse into the processing of agricultural products such as fuels, cooking oils, flour, and fabric.

Data from the CAIR program are important to U.S. economic policy. Better data means better markets analysis, better strategic planning, better forecasting, and more well-informed business decisions and policies. That impacts every citizen.

Waving Wheat Still Smells Sweet in Oklahoma

The Census of Agriculture is the most complete account of U.S. farms and ranches and the people who operate them. Every Thursday USDA’s National Agricultural Statistics Service will highlight new Census data and the power of the information to shape the future of American agriculture.

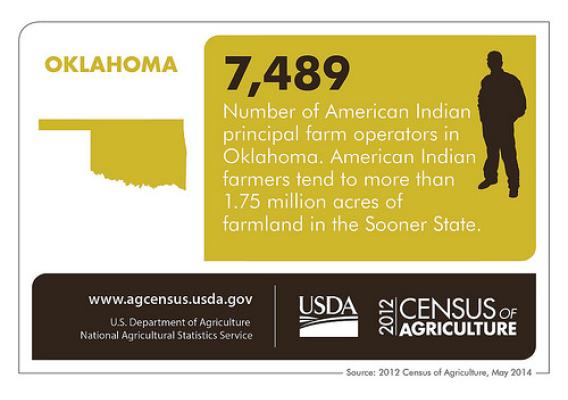
Oklahoma consistently ranks in the top five states for beef cattle and winter wheat, but our agriculture is much more than just rolling fields of wheat and cattle. With more than 80,000 farms counted in the 2012 Census of Agriculture, Oklahoma remains in 4th position in the number of farms in the nation. The bulk of our farms are less than 500 acres in size, but contributed $2.2 billion dollars to the market value of agriculture products sold (including government payments).

The average age of farmers nationally and in Oklahoma is now 58.3 years, increasing in both since the last census. Here in Oklahoma however, this increase is happening at a significantly slower rate than the U.S. average.

Montana Agriculture Keeps Growing

The Census of Agriculture is the most complete account of U.S. farms and ranches and the people who operate them. Every Thursday USDA’s National Agricultural Statistics Service will highlight new Census data and the power of the information to shape the future of American agriculture.

When you think of Montana agriculture, wheat and cattle come to mind. And why shouldn’t they? After all, our state ranks third in wheat production and tenth in cattle and calves inventory, according to the 2012 Census of Agriculture. That year, the combined market value of ag products sold for grains, oilseeds, dry beans, and dry peas was $1,787,162,000 and cattle and calves was $1,783,908,000. Montana’s total market value of agricultural products sold per farm was $151,031; which was up 59 percent from the previous Census of Agriculture in 2007, while the U.S. average was up 39 percent.

We have 28,008 farms and ranches in our state with an average size of 2,134 acres, which is down 5 percent from 2007.  Female principal operators of farms and ranches account for 15 percent of the total principal operators in the state while American Indians account for just 5 percent. Like most other states, the average age of our producers continues to increase to 58.9 years, climbing 1.1 years from 2007.

Counting Colorado's Cattle Country

The Census of Agriculture is the most complete account of U.S. farms and ranches and the people who operate them. Every Thursday USDA’s National Agricultural Statistics Service will highlight new Census data and the power of the information to shape the future of American agriculture.

Here in Colorado we take our farming seriously and the results of the last Census of Agriculture only reinforce that.

As of 2012, we now have almost 32 million acres of farmland, up slightly from the last census, conducted 5 years ago. Our farmers and ranchers sold nearly $7.8 billion worth of agricultural products in 2012. That’s an impressive 28 percent increase from the 2007 Census.

100 Years of USDA Market News: The Trusted Source - Then, Now and Always

Have you ever wondered how American farmers and businesses track the price of their commodities?  Today, farmers, ranchers, and the entire agricultural supply chain turn to USDA Market News – administered by my agency, the Agricultural Marketing Service (AMS) – for timely, reliable, unbiased data that serves as the information lifeline for America’s agricultural economy.

But 100 years ago, everyone was in the dark about how much things cost.  That’s why, in 1915, the first USDA Market News report was sent by telegraph, letting buyers and sellers across the country know the price of strawberries in Hammond, Louisiana.

California Boasts Unique and Powerful Agricultural Industry

The Census of Agriculture is the most complete account of U.S. farms and ranches and the people who operate them. Every Thursday USDA’s National Agricultural Statistics Service will highlight new Census data and the power of the information to shape the future of American agriculture.

From entertainment to high-tech to world-class wine, California’s diverse industries dazzle and delight people all over the world, and our agricultural industry is no exception. The Census of Agriculture results are in and the numbers confirm what many have always known – agriculture shines bright in The Golden State. California is the agricultural powerhouse in the U.S., generating over $42.6 billion in market value of agricultural products sold. With over 25.6 million acres of land dedicated to a diversified agricultural production, it is no surprise California leads the nation.

Diversity in all things is a proud hallmark of our state, and it lends its strength to our agriculture. California is the sole producer of an amazing array of commodities eaten by people all over the world. Enjoy pomegranate juice? Almost 99 percent of all pomegranates produced in the U.S. come from California. Love almonds? Very nearly 100 percent of all almonds produced in the U.S. are grown in California. Gotta have olives?  Close to 98 percent of all olives grown in the U.S. are from California. Need artichokes?  It is the California state vegetable, and as you might have guessed, almost all of the artichokes grown in the U.S. are grown in California. California also has most if not all of the dates, figs, kiwifruit, pistachios, raisins, sweet rice and walnuts in the country.

Old Dominion Agriculture by Numbers

The Census of Agriculture is the most complete account of U.S. farms and ranches and the people who operate them. Every Thursday USDA’s National Agricultural Statistics Service will highlight new Census data and the power of the information to shape the future of American agriculture.

Nothing can compare to the economic impact agriculture has in Virginia. 2012 Census of Agriculture counted more than 46,000 farms, which cover more than 8.3 million acres of farmland in the commonwealth. That’s nearly a third of our entire state! In fact, according to Virginia Department of Agriculture and Consumer Services, agriculture is our state’s largest industry.

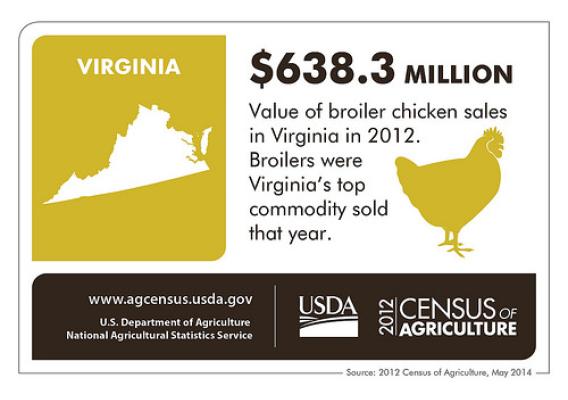
In the most recent census, Virginia farmers reported selling more than $3.7 billion worth of agricultural products. Of these, most came from the livestock sector. Broiler chickens were the top commodity sold in 2012, the year of the latest Census of Agriculture. That year, growers sold $638.3 million worth of broiler hens.

Big Data Implications for the Production of Official Statistics

Unless you live completely off the grid, you likely have heard of, and contribute to, “big data,” the often-used catch phrase describing massive (and ever-increasing) volumes of information stored digitally on computers, servers and clouds.

From advertisers using data mined from customer interactions; to government agencies making data public so developers can create beneficial mobile apps; to farmers applying statistical data to determine their production and marketing practices, a wide-variety of people and industries use big data.

Farming at the Crossroads of America

The Census of Agriculture is the most complete account of U.S. farms and ranches and the people who operate them. Every Thursday USDA’s National Agricultural Statistics Service will highlight new Census data and the power of the information to shape the future of American agriculture.

The 2012 Census of Agriculture results are out and, just as many predicted, Indiana agriculture continues to grow. True to our state's motto, "The Crossroads of America," the state of Indiana has a very diverse agriculture. The Hoosier State is a large contributor of corn, soybeans, tomatoes, ducks, milk, hogs, chickens and turkeys. And these are just a few of many commodities produced in Indiana.

According to the census results, there are 58,695 farms (ranking 7th nationally) on 14,720,396 acres of farm land in Indiana. Even though 2012 was a drought year, Indiana ranked 10th nationally in total sales by topping $11 billion, a 36 percent increase from just five years ago, which was the last time my agency conducted the Census of Agriculture. We also ranked 7th nationally in crop sales with just over $7.5 billion and 18th nationally in livestock sales with just over $3.6 billion.