
data

Need Ag Data Options? We Have You Covered from Beans to Sheep.

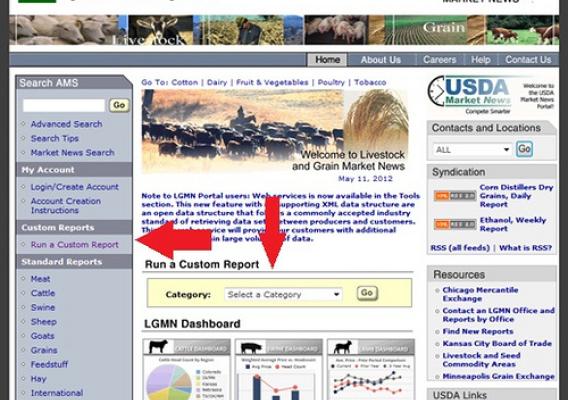
In our never-ending quest to satisfy the agricultural community’s and general public’s thirst for information, USDA Market News is collaborating with data.gov to add custom reports to our portal websites

USDA’s Agricultural Marketing Service (AMS) collects and publishes a high volume of market information for five major commodity areas.  With the addition of the custom reports feature, we are offering tools that will help farmers, ranchers, and businesses be able to manage, sort, and view our data in a more meaningful way. You can drill down and generate tailored historical reports that include only the data points you need and also download it in a variety of standard formats, like XML or plain text.

USDA’s New High-tech Guide to Green Thumb Glory

This post is part of the Science Tuesday feature series on the USDA blog. Check back each week as we showcase stories and news from the USDA's rich science and research portfolio.

With spring not that far away, the garden catalogues are starting to fly through the mail, but the “must read” of the moment for America’s estimated 80 million gardeners is the new Plant Hardiness Zone Map rolled out by USDA last week at www.planthardiness.ars.usda.gov.

Interactive Web Tool Maps Food Deserts, Provides Key Data

Cross posted from the Let's Move! blog:

Ensuring that Americans eat well and lead healthy lives is among our greatest goals at USDA.  First Lady Michelle Obama, of course, has taken an important role on this front – leading a national conversation and administration-wide effort.  As part of the Lets Move! initiative USDA is taking on the challenge of food deserts.  These nutritional wastelands exist across America in both urban and rural communities where parents and children simply do not have access to a supermarket.

Putting Rural Development on the Map

Today, the Economic Research Service (ERS) posted a new and innovative interactive mapping tool that makes it easy to visualize and compare rural economic and social conditions among counties, states, and regions. By creating county-level maps of the United States,  users can see how socioeconomic conditions vary across the United States, or within a state.