
statistics

Public Engagement as Necessary as Math, Science

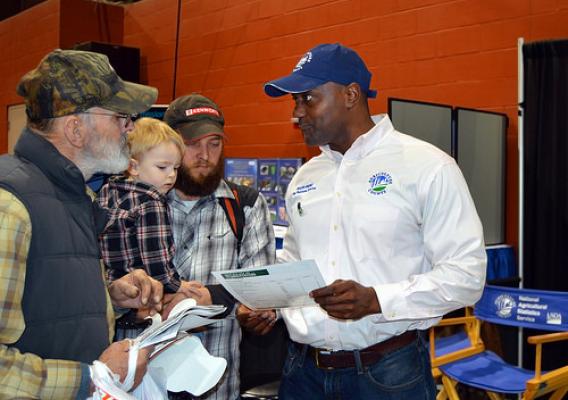
It goes without saying a successful statistician must have strong math, analytical and technical skills. You might be surprised to learn, then, just how much of my time is dedicated to listening to and talking with people. To be sure, I still use math and science daily. Two decades into my career, however, it’s those intentional, important interactions with farmers who answer my agency’s requests for information, as well with those who use my agency’s data, researchers, analysts and farmers themselves that keep me busiest.

Why? Because NASS is the “go to” source for official government statistics on U.S. agricultural production, economics, land, water, energy, environmental management and farmer demographics. Part of my job includes making sure farmers want to respond to our surveys and censuses and that researchers choose to use our data because it is the most accurate and unbiased.

New Statistics Help Guide New Farmer Programs

Farmland is one of the most precious resources we have in this country. After all, it’s what we rely on for our food, fuel, and fiber. Unfortunately farmland is also a finite resource, and getting access to it is one of the major challenges new and beginning farmers and ranchers face. This is also why USDA analyzes many aspects of farms and farmland distribution.

Since 2007 we have seen the American agricultural industry reshape itself. Each year, the number of farms has declined while the average farm size keeps getting larger. According to the new numbers we released earlier today the trend is continuing. There are now 2.07 million farms in the United States, down 1 percent from a year before, with the average farm size of 441 acres, up 3 acres from the previous year.

Deck the Halls with Holiday Data

From the smell of fresh pine, to the vibrant colors of poinsettias, the holiday season is the perfect time of year to spotlight America’s horticulture growers through the just released 2014 Census of Horticultural Specialties report. I’ve experienced firsthand how unique and amazing this industry is by working nationwide with producers and stakeholders as USDA’s National Agricultural Statistics (NASS) nursery and floriculture commodity specialist.

For example, did you know farmers can invest more than 8 years growing a Christmas tree for harvest? While there are not many producers dedicated to this work, according to our latest report industry sales grew. In 2014, there were 3,386 Christmas tree producers in the United States. That year there were a total of 20 million cut Christmas trees sold, valued at $367 million in sales. This was a significant increase from the last report in 2009, when only 13 million trees were cut and sold for a total of $250 million.

A Banner Year for Data: 5 New Ways We're Keeping Ag Statistics Current

USDA scientists work 365 days to provide safe and sustainable food, water, and natural resources in the face of a changing climate and uncertain energy sources. To recognize the contribution that agricultural science and research makes in our daily lives, this week’s “Banner Year” series features stories from 2015 that show the successes that USDA science and statistical agencies made for us all.

The past 12 months made for an eventful year in the world of agricultural statistics. In our efforts to remain true to our mission of providing timely, accurate, and useful statistics, we transformed several of our programs and tackled research to keep up with data needs of a changing agricultural industry. These new initiatives ensure that NASS continues to serve farmers, ranchers, and rural communities across the nation and that decisions impacting U.S. agriculture continue to be based on factual data.

Some of our most transformative work in 2015 included:

Producing Statistics about Hard-to-Reach Populations through Adaptive and Network Sampling

The number of people who had heart disease related surgeries, the percentage of Americans who take anti-depressants; the number of women who opt for natural childbirth, these are health statistics you likely hear about in the news frequently. But how do public health researchers obtain data about hard-to-reach, marginalized populations such as the homeless at-risk of contracting specific things like HIV/AIDS?

Producing statistics about hidden, underserved populations was one of the topics explored by Dr. Steve Thompson, professor of statistics at Simon Fraser University during the 25th annual Morris Hansen Lecture hosted by USDA’s National Agricultural Statistics Service (NASS). The lecture series was established by the Washington Statistical Society to honor Morris Hansen and his pioneering contributions to survey sampling and related statistical methods during his long and distinguished service at the U.S. Census Bureau. More than 200 people attended this year’s lecture at USDA’s Jefferson Auditorium in Washington.

Happy World Statistics Day 2015!

This post is part of the Science Tuesday feature series on the USDA blog. Check back each week as we showcase stories and news from USDA’s rich science and research portfolio.

Today is World Statistics Day and countries all around the world are celebrating the impact accurate statistics have on their lives. Here at the National Agricultural Statistics Service (NASS) we take pride in our long tradition of working with our counterparts around the globe. Not only are we actively networking with other United Nations member states, but we also partner with Canada and Mexico to cooperatively publish statistics.

Food Insecurity in U.S. Households Essentially Unchanged from 2013, but Down from 2011 High

USDA’s recently released annual report on the incidence and severity of food insecurity in American households marks 20 years of Federal statistics measuring U.S. food insecurity. This year’s report, presenting 2014 data, shows that 86.0 percent of American households were food secure throughout the entire year, meaning that all household members had access at all times to enough food for an active, healthy life. In 2014, 14.0 percent of U.S. households (17.4 million households) had difficulty at some time during the year providing enough food for all their members because of a lack of financial or other resources. Food insecurity, essentially unchanged from 2013, is down from a high of 14.9 percent measured in 2011.  

Looking back over the last several years, the food insecurity rate, as expected, rose in 2008 with the recession. But the food insecurity rate has not returned to pre-recession levels. Research shows that while modest improvements in food security have accompanied declining unemployment, other changes in the economy, including higher food prices, appear to offset the effect of unemployment declines. These higher food prices, along with an increase in overall inflation, are key factors preventing food insecurity rates from any substantial decline. Another Economic Research Service (ERS) study found that, particularly for households receiving benefits from USDA’s Supplemental Nutrition Assistance Program (SNAP), higher local food prices were related to higher food insecurity.

USDA Introduces New Food Safety Practices Survey for Producers, Processors

As the mom of a young boy, I am eager to learn more about the activities of growers and processors who supply my family and millions of others with our fruits and vegetables. In addition to being a mom, however, I am an agricultural statistician. Providing official statistics about agriculture gives me an opportunity to share knowledge about various aspects of the American food system, including food safety measures taken by fruit and vegetable operations across the United States.

To bring that crucial information into the spotlight, USDA’s Economic Research Service and the National Agricultural Statistics Service (NASS) joined efforts and created a series of surveys, which I have the honor of administrating. The surveys focus on food safety practices used in fruit and vegetable production and processing. The data obtained may inform our understanding of how the U.S. Food and Drug Administration’s Food Safety Modernization Act (FSMA) may impact operators.

Serving Up Statistics More Efficiently

This post is part of the Science Tuesday feature series on the USDA blog. Check back each week as we showcase stories and news from USDA’s rich science and research portfolio.

On any given day, a USDA National Agricultural Statistics Service (NASS) employee or representative might be contacting a farmer or rancher to request information about his or her operation. At the same time, another employee could be analyzing data provided by other producers, while other employees prepare one of the many statistical reports we publish each year on U.S. agriculture to help with business, research and policy decisions. 

Although the general cycle of data collection, analysis and publication of our agricultural estimates and census of agriculture programs is like a well-oiled machine, the recent rate of change is much more rapid than I can ever recall in the years I’ve worked in government statistics. New technology and changes in budgets, communications, leadership and workplace culture has allowed us to modernize to better serve the American public.

Big Data Implications for the Production of Official Statistics

Unless you live completely off the grid, you likely have heard of, and contribute to, “big data,” the often-used catch phrase describing massive (and ever-increasing) volumes of information stored digitally on computers, servers and clouds.

From advertisers using data mined from customer interactions; to government agencies making data public so developers can create beneficial mobile apps; to farmers applying statistical data to determine their production and marketing practices, a wide-variety of people and industries use big data.