
national agricultural statistics service

Hawaii’s Crown Jewels of U.S. Agriculture

Without a doubt, Hawaii is an influencer’s paradise when it comes to spurring creativity for storytellers, brands, and entertainment on social media platforms of all kinds. But are these “influencers in the wild” missing out on the crowning jewel of U.S. agriculture? Maybe not, but there is a wellspring of inspirational agriculture growing in Hawaii.

Find Where Your Food is Grown Using NASS Cropland Data Layer

Whether you are interested in seeing what’s grown in your area or you are a researcher with more in depth informational needs, NASS’s CropScape is a valuable tool for you. CropScape is the public user interface for the national land cover geospatial data product called Cropland Data Layer (CDL). The National Agricultural Statistics Service (NASS) released the latest annual CDL at 30 meters resolution on Feb. 5, 2020. The entire archive of historical CDL products are available on CropScape for you to browse, interact, visualize, download, and query the CDL dataset without needing specialized software tools.

Setting the Stage for Innovative Research

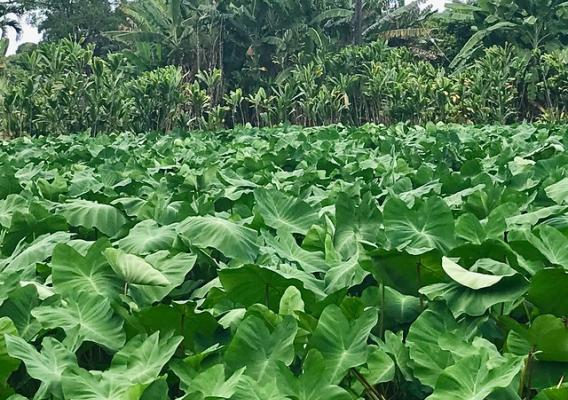
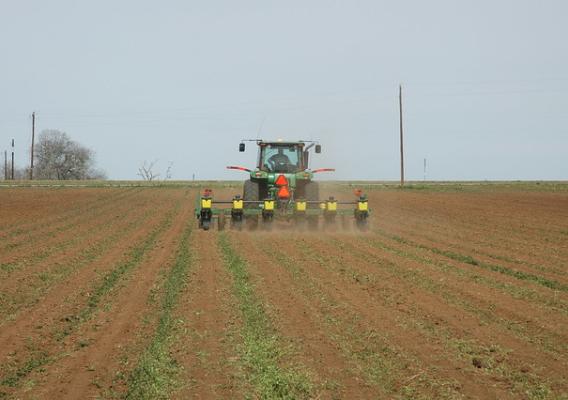
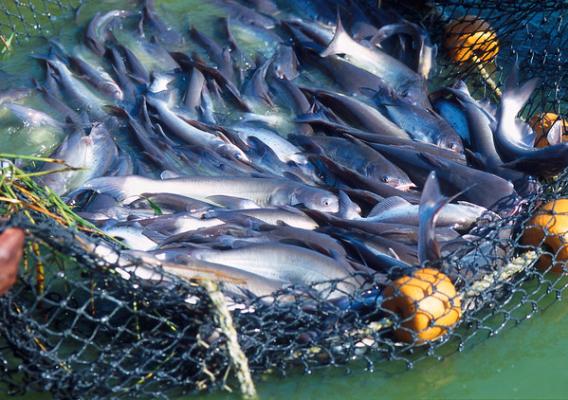
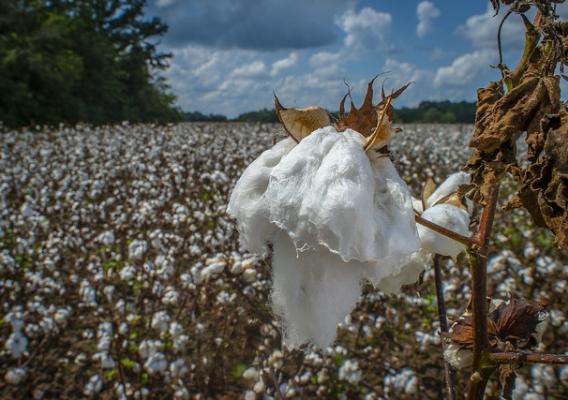
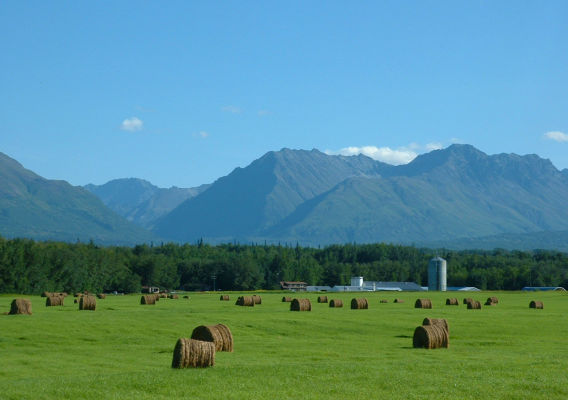
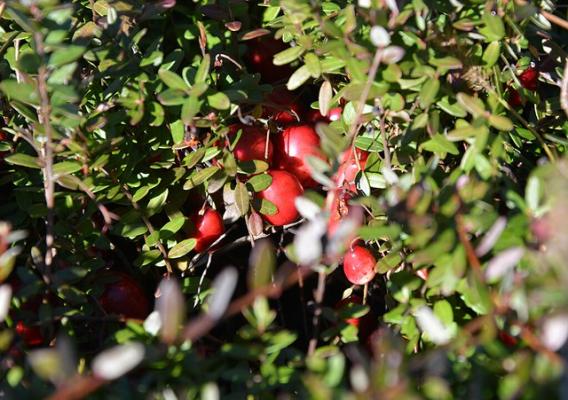
We’re fortunate to have robust food, fiber, fuel, and ag-related industries in America. Our food is safe, nutritious, and plentiful. Our fiber helps clothe people around the world. And we’re using value-added agricultural products to fuel machinery. However, agriculture is at a crossroads with the convergence of a growing global population, a changing climate, and limited natural resources. Fortunately, USDA science agencies work every day to develop new knowledge, technologies, and applications that help our farmers and ranchers work smarter, not harder.

Looking Ahead to the 2020 Crop Season, What to Expect from NASS Numbers

With the 2020 growing season about to begin for major field crops such as corn and soybeans, we’d like to walk through the surveys and data used during a complete season of field crop estimation. As a way to help you prepare for the 2020 data releases, we’ll explain in a series of articles the sources of data NASS incorporates into estimates as well as the timing and intention of the data as a way to let you know what to expect and how the data can be useful in your work.

NASS Builds Its Future on 150-Year Foundation of Agricultural Statistics

USDA’s National Agricultural Statistics Service (NASS) is well known for being the gold standard for U.S. agricultural data that can help you in your work. We are proud of our reputation for providing useful, accurate data in service to U.S. agriculture for more than 150 years. When extension agents or farm associations write grants to advance agricultural research, they turn to NASS data. When farmers and ranchers want to compare their operation to others or gather unbiased information for marketing decisions, they can turn to NASS data. And when local governments and ag associations are looking to tout the importance of agriculture in their county or state, they turn to NASS data.

Mississippi Rises to the Top of U.S. Aquaculture

Agriculture continues to be Mississippi’s top industry for revenue generated in the Magnolia State. Poultry is Mississippi’s largest agricultural commodity, leading as the most valuable livestock product including eggs-layers with sales valued at $3.1 billion. The 2017 Census of Agriculture showed that producers raised and sold $6.2 billion in crops and livestock.

Family Farms Flourish in Sweet Grown Alabama

Families are the cornerstone of agriculture in Alabama (PDF, 947 KB) where 97% of farms counted in the recent 2017 Census of Agriculture are family owned. Although the number of farms in Alabama decreased 6% from 2012, the average size of farms increased 3%, mirroring a trend seen in states across the nation. With 73% of farms connected to the Internet, Alabama farms and ranches continue to reach others across the globe.

Agriculture Grows in the Land of the Midnight Sun

The 2017 Census of Agriculture showed farming in Alaska is thriving and growing across many different sectors. Alaska saw increases in the number of farms with cut flowers, hogs, layers, vegetables, bees and honey, bedding plants, food crops grown under cover and more.

Cheese and So Much More: Ag Census Data Show Multi-Faceted Wisconsin Farm Economy

Wisconsin (PDF, 941 KB) is known as America’s Dairyland; however, the 2017 Census of Agriculture data show us that Wisconsin has a diverse agricultural industry. It’s no surprise Wisconsin ranks number one in cheese production, but did you know it also ranks number one in corn for silage, cranberry, and snap bean production?