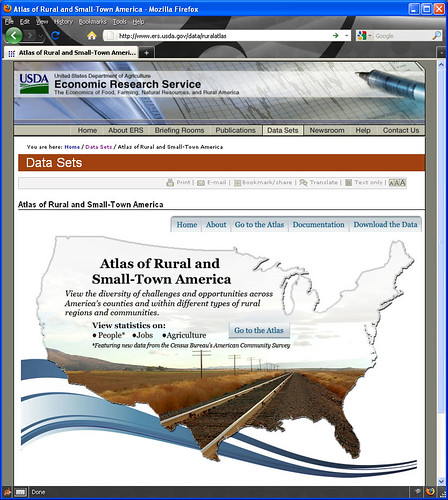
Today, the Economic Research Service (ERS) posted a new and innovative interactive mapping tool that makes it easy to visualize and compare rural economic and social conditions among counties, states, and regions. By creating county-level maps of the United States, users can see how socioeconomic conditions vary across the United States, or within a state.
The Atlas of Rural and Small-Town America – the Rural Atlas – contains a wide range of data on people, jobs, and the agricultural sector. The debut of the atlas capitalizes on the release in December 2010 of the first full set of county-level data from the Census Bureau’s American Community Survey (ACS), but it also includes data from several other Federal agencies. There are over 60 indicators in all, including ERS county types such as farm-dependent, manufacturing-dependent, recreation-based, and high out-migration counties, to name just a few. Demographic data from the ACS include age, race and ethnicity, education, migration, and household composition. The jobs category contains indicators of unemployment, jobs by industry, and household income. The agriculture data include farm numbers, percent of land in farms, and information on other farm and operator characteristics.
The interactive nature of the Atlas allows policy makers in the Midwest, for example, to compare employment trends in their area with trends in other regions. The maps can be filtered to highlight counties of a particular type. For example, a user may want to view population change in recreation-dependent counties, or in farm-dependent counties.
Users can view a selected indicator (e.g., migration) for the entire United States or can choose to zoom into a specific state, region, or sub-state area to compare counties within specific areas of interest. We’ve also built in the ability to click on any county and get a pop-up box containing all the statistics for that county. Maps that users create can be downloaded for presentations or publications, and the data can be easily downloaded into spreadsheets.
The Rural Atlas Team plans to update the design and data features regularly, pulling together data drawn from the U.S. Census Bureau, the Bureau of Labor Statistics, the Bureau of Economic Analysis, and the Office of Management and Budget, as well as from USDA.
Along with my colleagues, I invite you to visit and use the Rural Atlas.


