
census of agriculture

Counting All Farmers - Capturing the Many Faces of Agriculture in the 2017 Census

This post is part of the Science Tuesday feature series on the USDA blog. Check back each week as we showcase stories and news from USDA’s rich science and research portfolio.

The 2017 Census of Agriculture is still two years away but, at the National Agricultural Statistics Service (NASS), we work hard to continually improve the data we collect. The agriculture census conducted every five years is the one time we collect demographic information on today’s farmers and ranchers.

The 2012 Census found that 14 percent of the nation’s 2.1 million farms are run by a woman, and women make up 30 percent of all farmers when up to three operators per farm are included. Similarly, 25 percent of farmers were beginning farmers (ten years or less on their current farm) in 2012. But, as we get ready for the next census, we want to make sure that our data fully capture the role of women farmers and beginning farmers in agriculture today.

A Banner Year for Data: 5 New Ways We're Keeping Ag Statistics Current

USDA scientists work 365 days to provide safe and sustainable food, water, and natural resources in the face of a changing climate and uncertain energy sources. To recognize the contribution that agricultural science and research makes in our daily lives, this week’s “Banner Year” series features stories from 2015 that show the successes that USDA science and statistical agencies made for us all.

The past 12 months made for an eventful year in the world of agricultural statistics. In our efforts to remain true to our mission of providing timely, accurate, and useful statistics, we transformed several of our programs and tackled research to keep up with data needs of a changing agricultural industry. These new initiatives ensure that NASS continues to serve farmers, ranchers, and rural communities across the nation and that decisions impacting U.S. agriculture continue to be based on factual data.

Some of our most transformative work in 2015 included:

Wisconsin not only the "Dairy State" but also the "Cranberry State"

Most have probably heard Wisconsin’s famous moniker “The America’s Dairyland.” This nickname is definitely befitting considering our long history with milk production. But, while our milk, cheeses, and other dairy products are available year-round, the fall season brings attention to a completely different commodity. I’m talking about cranberries.

Alongside pumpkins, apples, and pears, cranberries are a staple of American cuisine during the fall months. But did you know that most cranberries in the United States come from Wisconsin? Our growers produce 60 percent of the cranberries in the United States?  Last year alone, more than 5 million barrels of cranberries came from Wisconsin. One barrel weighs 100 pounds, which means our growers produced more than 250,000 tons of this amazing fruit.

New #WomenInAg Infographics Show Impact of Women in Agriculture in Every State

From the classroom to the farm to the boardroom, women in agriculture are helping to pave the way for a better future. As leaders, it is our responsibility to make sure the next generation of women are educated, encouraged and empowered to take on the challenges of meeting the world’s growing food, fuel and fiber needs. To celebrate and honor the contributions of women in agriculture, USDA is releasing a series of state-by-state infographics detailing the impact women have on agriculture in each state and across the country. Be sure to share these infographics on social media or print them to help tell the story of women in ag in your state!

Over the past few months, we’ve also been featuring the powerful stories of women in agriculture on the USDA blog. By following the #womeninag tag on the USDA blog, you can read first-person accounts from women like Carissa Koopmann Rivers, a fifth generation cow/calf rancher from Sunol, California, Casey Cox, the Executive Director of the Flint River Soil and Water Conservation District, and Dr. Jewel Hairston, the Dean of the College of Agriculture at Virginia State University.

New Land Ownership Data Add Value to Many Policy and Research Questions

Whether they farm the land themselves or rent it out to others to farm, those who own agricultural land are taking measures to keep the land in their families. This is good news for those who worry about the United States losing agricultural land to competing pressures.

At USDA’s National Agricultural Statistics Service, we just released the findings from a survey of agricultural landowners conducted earlier this year. It confirmed some things we know already and generated lots of new information that farmers, policymakers, businesses and others will use to understand more about who owns farmland, who has and will have access to farmland in the future, what kinds of conservation and production decision landowners are making, and lots more.

August Reports Look into Farm Economy

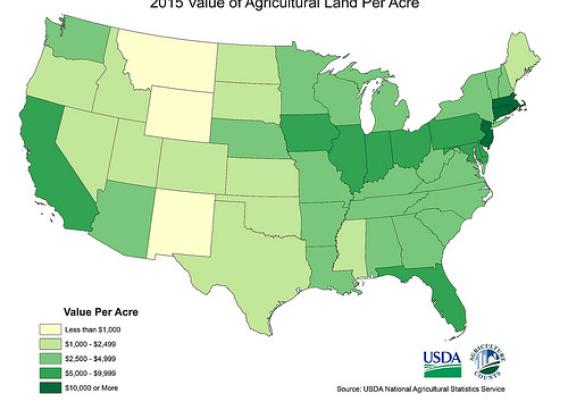
If you are interested in the farm economy, August is a great time of the year. Here at NASS, we start the month by putting out an analysis of farm production expenditures. In other words, how much does it cost to produce our foods, fuels, and fabrics. On the next day, we publish a report on the value of farmland in the United States and how much it costs farmers and ranchers to rent an acre of cropland or pastureland. This year, each one of the reports told a unique story. 

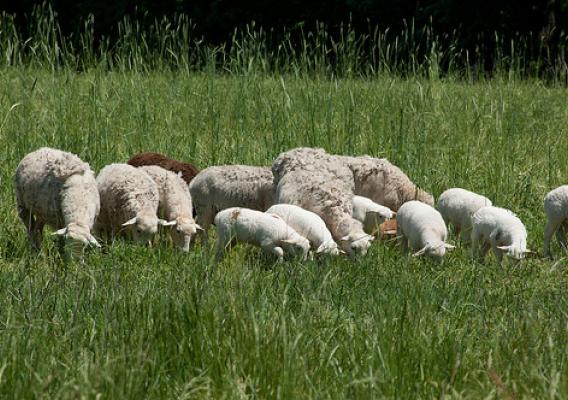
While the nearly $400 billion that U.S. farmers spend to produce food and fabric in 2014 is already staggering, it is even more interesting to see what is happening in the livestock sector. While feed has been the leading expense for farmers for a while now, the rest of the livestock expenses stayed on par with the other farm-related costs. For example, in 2010, U.S. farmers spent $24.4 billion on livestock, poultry, and related expenses, which was less than total rent costs and comparable to the $21 billion spent on fertilizer.

Mighty Agriculture in Little State Grows

The Census of Agriculture is the most complete account of U.S. farms and ranches and the people who operate them. Every Thursday USDA’s National Agricultural Statistics Service will highlight new Census data and the power of the information to shape the future of American agriculture.

Rhode Island may be one of the smallest States in terms of agriculture but the 2012 Census of Agriculture shows Rhode Island has something most states don’t have – more farmers. The number of farmers in Rhode Island tallied 1,243, up slightly from 1,219 in 2007. As of 2012, almost 70,000 acres of our land are now dedicated to farming. That’s quite a bit, if you consider the fact that we are the smallest state in the Union.

Our agricultural growth is boosted by the “buy local” movement. According to the Census, Rhode Island growers sold almost $6.3 million worth, or 10.5 percent, of our agricultural products directly to consumers in 2012. This is the second highest percentage in the nation.

USDA Fosters Market Transparency in Grass Fed Lamb and Goat Industry

According to the 2012 Census of Agriculture, there are over five million head of sheep and lambs in the United States, and over 2.6 million head of goats. A growing trend is producing these animals using grass fed production systems, especially for small to mid-sized producers.  

In response to the changing and widening marketplace, USDA’s Agricultural Marketing Service will begin releasing the National Monthly Grass Fed Lamb and Goat Meat report through their USDA Market News service today, Wednesday, May 13, 2015.  This is one of the first reports of its kind, filling a significant data gap for the industry and increasing transparency in the marketplace.

Serving Up Statistics More Efficiently

This post is part of the Science Tuesday feature series on the USDA blog. Check back each week as we showcase stories and news from USDA’s rich science and research portfolio.

On any given day, a USDA National Agricultural Statistics Service (NASS) employee or representative might be contacting a farmer or rancher to request information about his or her operation. At the same time, another employee could be analyzing data provided by other producers, while other employees prepare one of the many statistical reports we publish each year on U.S. agriculture to help with business, research and policy decisions. 

Although the general cycle of data collection, analysis and publication of our agricultural estimates and census of agriculture programs is like a well-oiled machine, the recent rate of change is much more rapid than I can ever recall in the years I’ve worked in government statistics. New technology and changes in budgets, communications, leadership and workplace culture has allowed us to modernize to better serve the American public.

USDA Celebrates Mothers, Farmers, and Industry Leaders

In honor of Mother’s Day, USDA thanks the nearly 100 wonderful women growers and handlers for dedicating their time and service to their respective industries through our federal fruit and vegetable marketing order committees and boards.  We spoke to a few about being a farmer, mother, and marketing order industry leader.

Kelly McKnight, of the Washington Potato Committee, is a mother of four and a fifth- generation farmer.  McKnight learned the ins and outs of marketing orders from her neighboring potato farmers, alongside an extended network of fellow farmers’ daughters recruited to the committee.  Although the industry is small, McKnight credits the marketing order presence and members for keeping it strong. The committee serves as a network of support, mentorship, and resources, and further builds relationships with related organizations.