
cropscape

Every Day is Earth Day for Ag Producers

After a trip to Colorado’s Pikes Peak in 1893, Katharine Lee Bates wrote the lyrics to “America the Beautiful.” The memorable words paint a sensory-rich picture of “amber waves” and “fruited plains” that celebrate our land and the true wealth of any nation – agriculture. Today, according to the 2017 Census of Agriculture, the United States has more than 900 million acres of land in farms; that’s 40% of all U.S. land. And we rely on the 3.4 million producers, around 1% of our population, to manage that land and provide food, feed, fiber and fuel for our nation and the world.

Find Where Your Food is Grown Using NASS Cropland Data Layer

Whether you are interested in seeing what’s grown in your area or you are a researcher with more in depth informational needs, NASS’s CropScape is a valuable tool for you. CropScape is the public user interface for the national land cover geospatial data product called Cropland Data Layer (CDL). The National Agricultural Statistics Service (NASS) released the latest annual CDL at 30 meters resolution on Feb. 5, 2020. The entire archive of historical CDL products are available on CropScape for you to browse, interact, visualize, download, and query the CDL dataset without needing specialized software tools.

U.S. Agricultural Production Systems of the Future: What Research is Needed Now?

Depending on where you live in the United States, the first thing that likely comes to mind for agriculture production systems are the large fields of corn, soybeans, wheat or cotton seen growing each summer. But spend a few minutes looking at CropScape, a color-coded map that charts where almost a hundred different types of U.S. crops are grown currently, and you begin to appreciate the diversity and regionality of production systems. This map shows that although there are U.S. regions where crop production is dominated by a few commodity crops, there are others where U.S. farmers are growing a wide array of fruit, vegetables, and other “specialty” crops. Agricultural Atlas maps produced by USDA’s National Agricultural Statistics Service show similar diversity in livestock production, including land in pasture and range production.

Need for Geospatial Data Grows Across the Country

This post is part of the Science Tuesday feature series on the USDA blog. Check back each week as we showcase stories and news from the USDA’s rich science and research portfolio.

During the month of April we will take a closer look at USDA’s Groundbreaking Research for a Revitalized Rural America, highlighting ways USDA researchers are improving the lives of Americans in ways you might never imagine.

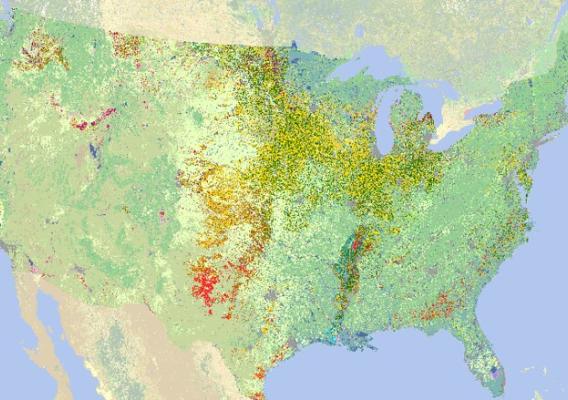
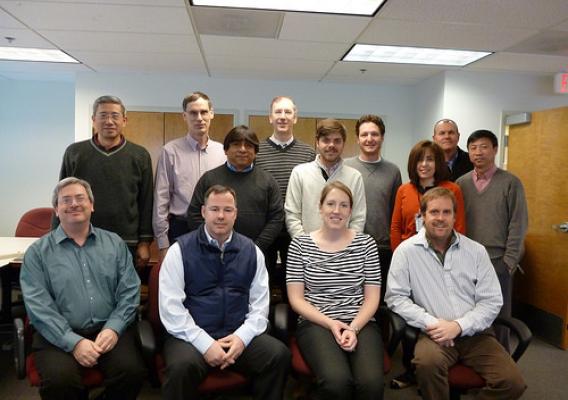
Over the past several decades, satellite imagery has emerged as one of the most valuable new tools in modern agriculture. At USDA’s National Agricultural Statistics Service (NASS), we strive to remain at the forefront of this technology to continually advance our statistical products in service to U.S. agriculture. To keep abreast of how our counterparts in other countries are implementing this exciting new technology, last month we hosted representatives from the Canadian and Mexican agriculture departments in a Tripartite meeting. As geographic neighbors and statistical collaborators, we are particularly interested in each others' work and how we can learn from each other.

It was exciting to see that Statistics Canada, working with Agriculture and Agri-food Canada, is researching new remote sensing-based yield models, using vegetative indices, agro-climactic data, and survey data for 21 crops. As a result of this innovation, Stats Canada is planning to use only remote sensing to set their official estimates for these crops rather than conducting traditional surveys. This is a tremendous step forward for a statistical estimates program that we will be watching with great interest.

Back to School with Statistics, Join USDA's Virtual Open House

A new academic year is here for millions of students and teachers across the country, and in spirit of the many back to school nights and open houses taking place, I’m encouraging you to explore USDA’s International Year of Statistics Virtual Open House.

The International Year of Statistics, sponsored by more than 2,000 organizations – including the USDA - is a worldwide event to help teach everyone about the powerful and far-reaching effects of statistics. When people hear the word “statistics,” they often think of sports statistics or the course they took and struggled to pass. While you can think of statistics in these terms, there is more to the relationship between you and statistics than you may imagine.

Bringing Ag Data to Life through Satellite Imagery

This post is part of the Science Tuesday feature series on the USDA blog. Check back each week as we showcase stories and news from USDA's rich science and research portfolio.

2013 is the International Year of Statistics. As part of this global event, every month this year USDA’s National Agricultural Statistics Service will profile careers of individuals who are making significant contributions to improve agricultural statistics in the United States.

While most of the National Agricultural Statistics Service (NASS) statisticians studied mathematics, economics or agriculture in school, my career path started in a completely different place. I came to NASS in the 1990s as an IT specialist to help the agency evolve its use of geospatial technology and contribute to the remote sensing acreage estimation program. And so, while most of the agency staff learned about agriculture by visiting fields, my knowledge of this intricate subject came from studying and analyzing satellite imagery.

Farm Internet Access on the Rise, Now Let’s Connect

This post is part of the Science Tuesday feature series on the USDA blog. Check back each week as we showcase stories and news from the USDA’s rich science and research portfolio.

It’s no secret that the landscape of rural America and the ways in which farmers and ranchers do business is evolving. These changes are happening not only in the fields, in terms of what is produced and how, but also in the office and home with how producers access information and conduct business.

New Geospatial Data Service Now Available

The National Agricultural Statistics Service (NASS) proudly serves as the statistical arm of the U.S. Department of Agriculture. What some may not realize is that NASS provides statistical information in a variety of formats beyond the traditional paper report, which dates back more than a century.

Just yesterday, NASS launched a new geospatial data service called CropScape. Operated by my team in NASS’s Research and Development Division, CropScape significantly eases users’ access to agricultural geospatial satellite products. By applying the best practices in science and technology, this service links space and agriculture.