This post is part of the Science Tuesday feature series on the USDA blog. Check back each week as we showcase stories and news from USDA’s rich science and research portfolio.
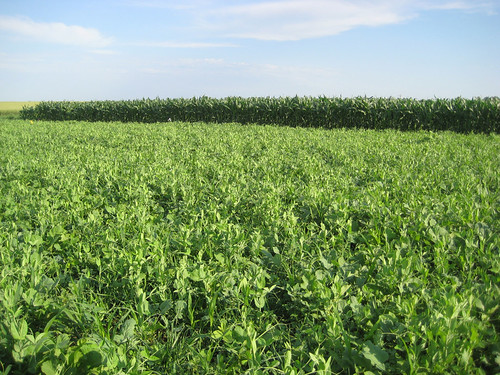
Whether you’re a home gardener or a commercial grower of vegetables, cotton, or other agricultural crops, as soon as the growing season is over, you may want to consider planting cover crops—grasses, legumes and small grains that protect and improve the soil.
Cover crops, which are typically grown off season, help reduce soil erosion, increase organic matter and control weeds. At the same time, they can lessen the effects of extreme weather conditions such as drought and help improve water and air quality as well as wildlife habitat.
But how do you know which cover crops are right for you? Although a lot of information is available about individual cover crops, there’s a need to show how these crops could potentially complement one another when grown together.
An online tool developed by USDA’s Agricultural Research Service (ARS) scientists is a good place to start.
Soil scientist Mark Liebig and his colleagues at ARS’s Northern Great Plains Research Laboratory in Mandan, North Dakota, have developed the “Cover Crop Chart” to provide information on suitable crops to help you meet your individual production and management goals, big or small.
The new chart is a compendium of information from various sources, including research conducted at Mandan, on more than 50 crop species. This useful visual aid provides a first step for growers to learn about cover crops and how certain cover crops might fit in with others being planted.
Crops are categorized in the chart by similar attributes—cool season or warm season, grasses or broadleaf, and legumes. The chart lists details on growth cycle, water use, plant architecture, forage quality, pollination and more, thereby giving growers an abundance of information to help determine what crops might work best for them.
To download a free copy of the Cover Crop Chart, go to www.ars.usda.gov/pa/ngprl.


