March is National Nutrition Month. Throughout the month, USDA will be highlighting results of our efforts to improve access to safe, healthy food for all Americans and supporting the health of our next generation.
About half of all American adults—117 million individuals—have one or more preventable chronic diseases, many of which are related to poor quality eating patterns and physical inactivity. These include cardiovascular disease, high blood pressure, type 2 diabetes, some cancers, and poor bone health. More than two-thirds of adults and nearly one-third of children and youth are overweight or obese. Trends in food intake show that Americans are not consuming healthy eating patterns.
Earlier this year, the US Department of Health and Human Services’ Office of Disease Prevention and Health Promotion and the US Department of Agriculture’s Center for Nutrition Policy and Promotion released the 2015-2020 Dietary Guidelines for Americans. Written for use by health professionals and policy makers, the Dietary Guidelines is released every 5 years to provide nutrition guidance for Americans age 2 and older to prevent diet-related chronic disease and maintain health.
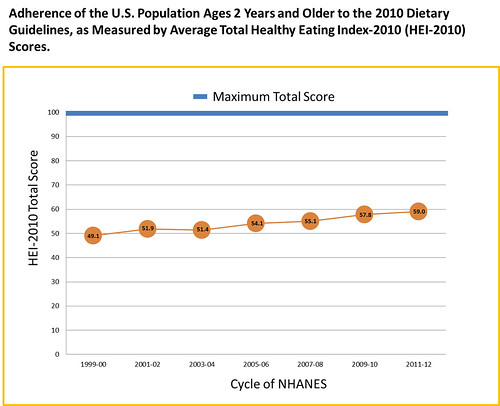
The Healthy Eating Index (HEI) measures how the nation’s food choices align with the Dietary Guidelines. The nation’s current HEI score is 59 out of 100. The HEI score in previous years was even lower. At the same time, diet-related chronic disease rates over the last 25 years have risen and remain high. Given the robust science behind the Dietary Guidelines, it is not an understatement to suggest that if we were to eat closer to the Dietary Guidelines – and saw our nation’s HEI scores get closer to 100 – we would see reductions in the prevalence of diet-related chronic disease.

With each edition of the Dietary Guidelines, the HEI is updated to align with the most recent nutrition recommendations. The current version is HEI-2010 and scores the average American diet based on intakes of total fruit, whole fruit, total vegetables, greens and beans, whole and refined grains, total protein foods, seafood and plant-based protein foods, sodium, and calories from solid fats, added sugar, and alcohol beyond a moderate level. The tool is being updated to reflect the 2015-2020 Dietary Guidelines released in January.
Monitoring scores in the U.S. population is one of many applications of the HEI. An HEI score can be calculated for any defined set of foods including dietary intake data, menus at restaurants, and a market basket of foods. Use of the HEI can apply to surveillance, policy, epidemiologic, clinical and behavioral research.
More than 200 scientific publications have featured the use of the HEI. The number and scope of publications continue to grow each year, with nearly 90 papers published in 2015 alone. A majority of studies published over the years have examined the association between overall diet quality and health outcomes. Examples of health outcomes studied have included cancer, cardiovascular disease, type 2 diabetes, dental health, and ocular health. Researchers are also interested in comparing HEI scores for specific subgroups of the population such as children and adolescents, older adults, and specific race-ethnic populations. Scores for children and older adults were recently made available on the CNPP website. HEI has also been used to score the U.S. Food Supply and to evaluate how USDA food distribution programs such as National School Lunch Program and Food Distribution Program on Indian Reservations provide foods that align with the Dietary Guidelines.
Learn more about the HEI here.

