USDA’s Economic Research Service (ERS) recently released its Farm Income forecast for 2016. Net cash income and net farm income (which includes the value and costs of items like depreciation, home consumption of farm goods, and unsold inventory) are both expected to fall slightly compared to 2015, but by much less than last year. Net cash income is expected to fall by 2.5%, or about $2.3 billion, and net farm income by 3%, or about $1.6 billion. Last year net cash income fell by 27% and net farm income by 38%.
A large portion of the forecast decline is from lower livestock receipts, expected to be down by about $7.9 billion. Crop receipts are also forecast to be lower by $1.6 billion. On the other hand, input costs are forecast to be down by $3.8 billion, and government payments are expected to be $3.3 billion higher.
The cost of production relative to projected sales remains tight for most commodities. Returns over variable costs leaves very little additional revenue to cover cash rent or pay the operator. As a result, it is likely farmers will continue to rely on reserves built up when farm incomes were record high and to lower costs wherever possible, including renegotiating rental contracts, minimizing input costs, and possibly taking out more operating loans.
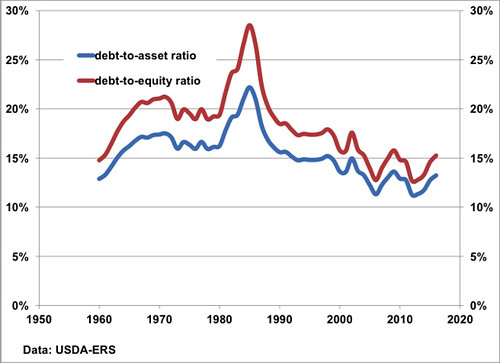
A slightly higher debt (mostly from operating loans) and lower assets (from some erosion in land values) will result in a slight increase in the debt-to-asset level in 2016. While such an increase indicates rising financial pressures, those ratios still remain near historic lows. The lowest debt-to-asset ratio we have seen for decades was 11.3% in 2012, and the highest was 22.2% in 1985 during the farm financial crisis. This year the ratio is forecast to be 13.2%, compared to 12.7% in 2015.The higher the debt is relative to assets (the lower the equity), the greater the indication of financial stress in the sector. For example, the peak farm bankruptcy rate coincided with the high debt-to-asset ratios of the mid-1980s.
The slower rate of decline in farm income forecast for 2016 may indicate we have leveled off at new price and production patterns. Projected prices in the USDA’s long-run baseline through 2025 for most major commodities remain flat over the next 5 years, before growing slowly again nearer the end of that period. This pattern is consistent with the long-term trend of falling, but flattening real prices for food commodities since World War II. Although modest compared to last year, continued softening in farm income adds to the economic strain being felt by many rural communities—especially in areas that are farming-dependent.
While overall net farm income is down, some sectors are showing gains. Focusing on the 850,000 farms that are classified as farm businesses, net cash income is actually forecast higher in 2016 for most crop specializations—corn farm net cash income is forecast to rise by 2%, soybeans and peanuts by 3%, wheat by 10%, and cotton and rice by 23%; specialty crops net cash income, however, is expected to fall by 5%. Dairy and hog farm net cash income is forecast down (31% and 3%, respectively), as is poultry and egg farm net cash income, by about 2%; but beef farm net cash income is expected to rise by 3%.
If we take a closer look at farm household income, which includes income from both on-farm and off-farm sources, we can see that median farm household income has grown more rapidly than U.S. median household income since the recession, mainly as a result of improved off-farm income. Nearly all U.S. farm households have some income from off-farm sources, making a stronger U.S. economy important for farm households, even though it may also mean a strong dollar and more difficult trade opportunities. For family farm households, median farm income is up slightly, unlike 2015, and median off-farm income is up 4%. Overall, median total farm household income is forecast up 5% in 2016 to a record level of $81,666. That trend is forecast to hold across all farm households, regardless of size or type.


