

USDA’s National Agricultural Statistics Service (NASS) recently released the results from the 2017 Census of Agriculture (COA). Unlike the annual estimating program, which estimates acreage, yield, production, price and value on major commodities, the COA takes a look at the people who are our farmers and ranchers and accounts for minor commodities produced across the Grand Canyon State.
Key Highlights from Arizona’s 2017 COA:
There were 19,086 farms in Arizona in 2017, a decrease of 4.6 percent from 2012. Most of the decrease was in Maricopa and Pima counties. Ninety-five percent of farms and ranches were family owned.
Harvested cropland increased 2.9 percent to 915,647 acres. Pinal, Maricopa, and Yuma counties accounted for 67 percent of the state’s harvested cropland.
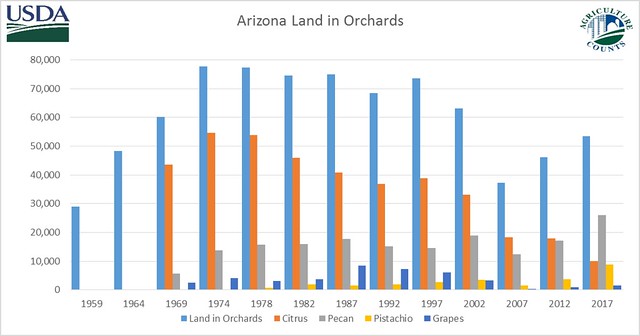
Land in orchards increased 16 percent to 53,518 acres. Cochise County showed the largest increase from 2012, at 129 percent. Yuma County experienced a drop of 26 percent. The chart shows how citrus began its gradual decline in the 1980s. Pecan and pistachio acreage has increased significantly, especially since 2012.
Economics
The total value of agricultural production in Arizona was $3.85 billion. The 400 largest farms in terms of sales accounted for 90 percent of the total value. Maricopa, Yuma, and Pinal counties accounted for 83 percent of the total Arizona value. The top commodities were vegetables/melons/potatoes at 26.2 percent of the total value, milk from cows at 22.2 percent, and cattle at 16.6 percent. These 3 categories accounted for 65 percent of the total agricultural production value in Arizona.
Demographics
The 2017 COA questionnaire allowed farmers and ranchers to designate multiple people per farm as principals. The decision-makers on farms were referred to as producers instead of operators. NASS also added questions about producers with military service and young producers.
The average age of all producers (32,796 in Arizona) was 59.4 years old compared to 58.2 in 2012. Arizona has the distinction of having the highest percentage of female producers of any other state. Forty-nine percent of all producers in Arizona were female. The national average was 36 percent.
There were 19,481 American Indian producers on 11,729 of Arizona farms, accounting for 59.4 percent of all producers on 61.5 percent of the farms.
NASS could never accomplish this project without the cooperation of Arizona’s farmers and ranchers. We are extremely grateful for their input.