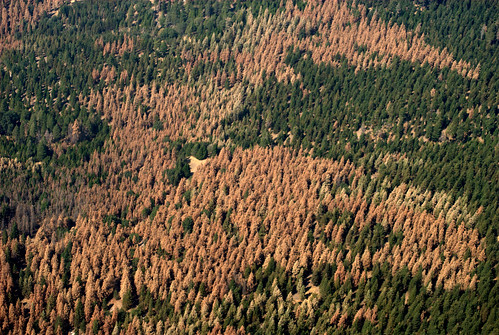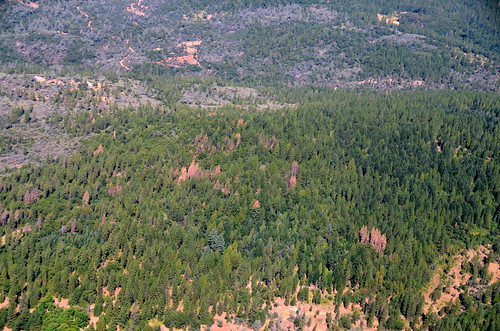
From 2006 through 2016, more than 100 million trees died in California due to the combined impacts of drought and bark beetles. Although tree mortality is part of a natural life cycle, at a massive level it can lead to adverse economic and social effects. So many dead and dying trees increase the risk of wildfire and threaten lives and property.
Bark beetles are about the size of a grain of rice. They are drawn to trees that have become stressed, diseased, or injured by storms, wildfire, or human activity. After successfully attacking a tree, they release pheromones that attract more beetles, making it difficult for the diseased tree to fend them off. Normally, the sap produced by a healthy tree pushes the beetles out. But when a tree is diseased or stressed by drought, it may not be able to produce enough sap to protect it from being overrun by beetles.
The USDA Forest Service has played an important role in helping land managers anticipate the risk of tree mortality through the 2017 Bark Beetle Forecast for California. This tool, which analyzes historical aerial survey data and variables such as precipitation and stand density, can determine the most likely location of bark beetles causing tree mortality.
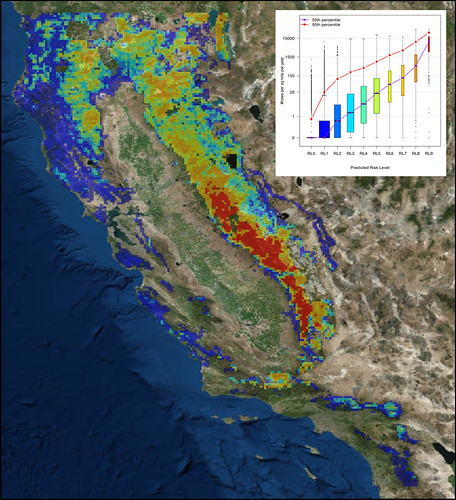
Haiganoush Preisler from the USDA Forest Service’s Pacific Southwest Research Station is one of the tool’s creators. According to Preisler, this is the first instance that a map featuring ranges of likely outcomes based on historic aerial survey data has been produced to forecast tree mortality in the Western U.S.
While aerial survey maps show what is presently on the ground, forecast maps give managers and others an idea of what to expect in the near future. The maps highlight those regions with the highest risk of tree mortality from beetles and drought, while accompanying boxplots display the range of mortality values to expect within each risk level based on what was observed historically.
Knowing what impacts to expect in one to two years enables forest managers to plan and prioritize hazard tree removal, pest suppression activities, and fuel reduction treatments… and to anticipate where firefighters will be most likely to need access.
